Writing Results
Think of the story you want to tell. Choose and present only those results that are relevant to your hypothesis. A morass of experimental results unilluminated by a hypothesis and unembellished by a discussion is insulting and confusing to your reader. from “How to Write a Thesis”
Results are the ultimate objective of scientific research: here you summarize the data collected and the statistical treatment of them. Therefore, this section consists of the observations and measurements recorded while conducting the procedures described in the methods section. These components must address the questions raised in the introduction and any hypotheses formulated there. However, you do not get to provide interpretation here. In fact, the rule is results only (the “fun” part of interpreting Results gets written in the Discussion section). Even so, writing a Results section logically presupposes raw data has been generated, analyzed, and transformed for consumption by a reader. The analysis itself is mostly performed privately; except for the procedures and statistical tests explained in the Methods, the hard work of processing results gets little representation in the Results section. This can be emotionally tough to handle when 6 months of your life gets distilled into a single bar graph on one-quarter of a page, even when the result is hugely positive. Existential angst is the silent partner in every Results section.
Results are often presented in numerical form and indeed are more reader-friendly if presented graphically in tables and graphs than in written text. The writer must aim for ACCURACY, INCLUSIVENESS, and SYSTEMATICITY, as these results are the primary and permanent source of scientific knowledge. This does not mean there is no creativity allowed in the Results section. In fact, the wise writer uses graphs and figures to highlight the most important or interesting information. Otherwise, arrange the results from most to least relevant or strong. You will also want to point out results that didn’t amount to much of anything, although this is unsatisfying. The only results that are often not reported are those with no pattern at all; that is, results that are uninterpretable.
The Results section may also be divided according to subheadings, especially if there were very strong trends or if there were multiple phases of the project. The section itself uses the subheading “Results”. Grammatically, results are reported using the present tense, e.g. “The results show that 79% of men find the advertisements in Sports Illustrated more useful than the advertisements in GQ”. Also note that the Results section reads more like a well-organized list than a story.
Organization should “match” that of the Methods section. If the Methods section was a single, straightforward test, then the Results can follow the classic order: arrange from most to least relevant to answering the RQ. If your Methods section was structured, consider structuring the Results section similarly. Feel free to use subheadings in the Results section. Often, this can make it easier for the reader to follow. Sentence-wise, Results are a two-tailed beast: a general statement of the result and the stats that prove it, e.g., “X was positively correlated with Y, p <. 01″.
What to include:
- positive and negative results that answer the research question (most important)
- data you can use to outline important trends
- results that you intend to address in the discussion section
- results of statistical analyses, often in conjunction with measurements analyzed
- results related to those obtained by other researchers, especially if they disconfirm other results, or are controversial
- results which didn’t achieve statistical significance AND are discussion-worthy
Example (Quantitative) || A Psychological Exploration of Engagement in Geek Culture
Results
Narcissism.
As with the previous studies, narcissism was again correlated positively with geek engagement, r(347) = .30, 95% CI [.19,.41]. In addition, narcissism was marginally positively related to media awareness, r(347) = .11, 95% CI [.00,.22], positively related to political trust, r(347) = .20, 95% CI [.09,.31], and engagement in civic organizations, r(347) = .13, 95% CI [.02,.24], but negatively correlated with political behavior, r(347) = -.16, 95% CI [-.27,-.05] and civic knowledge, r(347) = -.16, 95% CI [-.27, -.05]. Narcissism was unrelated to future orientation, r(347) = -.08, 95% CI [-.19, .03].
Analysis: Positive and negative results are colored orange. Note that measures of statistical significance are shown after each item, set off by commas (like a subordinate clause or appositive). An item that was tested but failed to achieve statistical significance is shown in blue.
Note: Not all results which turn out non-significant will make it into the results section. Occasionally, a test churns out such nonsensical data that nothing can be said about it. In these cases, the researchers may choose not to include the test and results at all, even though the work was done. While this contributes to publication bias, it’s also quite difficult to write anything about results with no pattern. This is NOT the same thing as failing to report that a tested item did not achieve statistical significance. If your method should have had either a positive or negative result, but neither happened, that IS the result; the chance of publication is low, but the information is still valuable, and you should write it up. For undergraduate and much graduate work, such “non results” indicate important places where the field is failing to ask the correct questions or using the wrong methods to explore.
Example (Qualitative) || Socio-Psychological Factors Driving Adult Vaccination: A Qualitative Study
Drivers and barriers to vaccination: Findings of the thematic analysis
Thematic saturation was reached at 14 interviews (i.e. no new themes appeared in the last 6 interviews that were carried out). Five overarching themes emerged from the analysis: 1) perceived health and health behaviors; 2) knowledge; 3) vaccination influences; 4) disease appraisal; and 5) vaccination appraisal. These are reported in detail below. Illustrative quotes are provided in Tables 4 and 5.
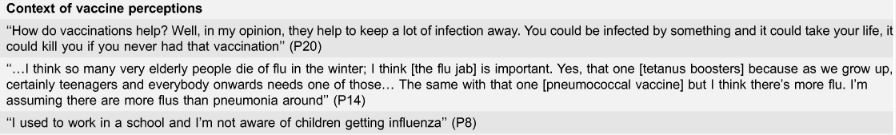
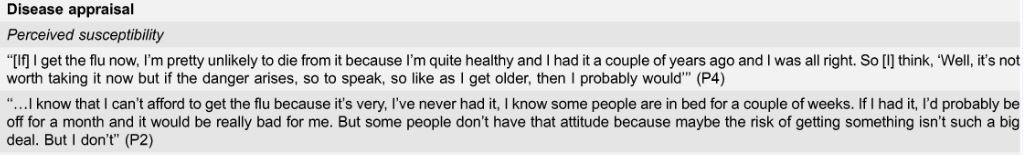
Analysis: Qualitative research also entails two part communication: the result and examples of the raw data illustrating the thematic category. Here, the authors first explain at which point new thematic categories stopped emerging (in orange; important because an over-abundance of themes indicates a lack of patterns — essentially, the qualitative version of uninterpretable data). The themes are listed, and the tables provide supporting data for the theme from the interviews.
Using Figures
Results sections can be the most frustrating for novices to read and most interesting to experts. Consider both of these audiences when constructing the results. Clear, even redundant, labeling of figures can be useful. Figure legends should stand on their own, but restricted only to the figure. The text should reference specific figures as they come up, but should not merely refer readers to a table or figure for the information; some contentful statement must be included with the reference to the figure. Balancing the needs of both expert and non-expert readers will increase the impact of your research.
Figure Examples from
- Page 2 — Introduction
- Page 3 — Methods
- Page 4 — Results
- Page 5 — Discussion
- Page 6 — Action Plan and Outlines